Introduction
In this datastory, we examine the connection between the information-seeking behavior of people towards COVID-19 on Wikipedia and its relation to real-world actions during the pandemic. To do this, we compile a dataset containing Wikipedia pageview statistics for COVID-19-related articles in 38 different languages that are representative of various countries. By comparing these pageview statistics to COVID-19 deaths and cases in these countries, we can compare the digital evolution to the physical one.
We also use the Google mobility dataset and a trust dataset measuring people's trust in their government to visualize the complex relationship between information-seeking behavior, trust, and mobility during the COVID-19 period. Finally, we delve deeper into selected countries to get a more detailed understanding of these relationships.
Our Datasets: Tl;dr
Wikipedia Pageviews
Timeseries of pageviews of COVID-19 related articles by language and by day for the entire pandemic.
Google Mobility
Google mobility dataset containing the evolution from baseline of mobility classified in 6 different categories.
Trust Dataset
Dataset representing the trust of countries inhabitants towards their government, journalists and science.
COVID-19 Cases and Deaths
Number of cases and deaths per country and per day since the beginning of the COVID-19 pandemic.
-
38 Languages
-
5.2k Articles
-
4.7M Datapoints
-
38 selected countries
-
6 categories
-
2.1M Datapoints
-
38 Selected countries
-
114 Datapoints
-
219 Countries
-
921 Days
-
200k Datapoints
Processing the Datasets
Wikipedia pageview statistics
To begin with, we had the full dataset of all COVID-related articles in 175 languages. Of course, this does not align with our research questions so we performed the following preprocessing steps:
-
To narrow our focus, we eliminated any languages that had fewer than 10 articles and any languages that were not specific to a single country (such as English and Spanish). We determined that a language was specific to a country if at least 75% of the people who spoke it lived in that country. We treated each country as having a single dominant language and we validated this assumption with further investigation.
-
After this step, we are left with 38 countries/languages, which represents 30.6% of the total world population. From there, we extracted the pageview statistics from the 1st january 2020 to the 31 july of 2022.
Mobility, trust and COVID datasets
The preprocessing of these datasets was straightforward, we only had to adjust them by selecting the right countries and timeframes.
A first look at the datasets
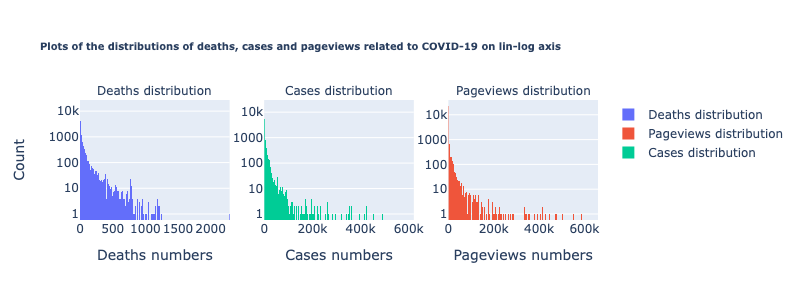
By examining the histogram of the distributions of our three variables, we can see that they are skewed, i.e. right-heavy-tailed. The right tail is fat and long for cases and pageviews, and thinner and shorter for deaths. The ECDF plots confirm this, showing that 95% of the pageviews and cases are contained within the first 5% of the range of the data, and 95% of the deaths data are contained within the first 12.5%. This is a strong indicator that we'll have to take the log of the data to extract meaningful information.
Great! Now that we've identified the types of data we're working with, let's see how they may be connected. How was the COVID-19 pandemic liked to how much people sought out information? Time to find out on the next page! Let's uncover interesting patterns or trends. This should be fun!